Using this tool
This tool evaluates cost-benefit for new tools or technology being introduced to a swine enterprise. When implementing a new technology, costs include things like equipment start-up cost, equipment maintenance cost and training cost. Benefits are measured as the dollar value of pigs produced in a year, so are related directly to the number of pigs produced. The calculations are layered on top of existing operations, so that only those costs that are related to the new technology need to be entered. For example, you do not need to enter all feed, energy, labour, and veterinary costs in the model unless they are impacted by the new technology. This model compares your current situation with one that includes the new technology, so you only need to enter the things that change.
This webtool's calculations tell you the incremental cost-to-benefit ratio of a new technology.
- If it is greater than 1, the new technology is estimated to be profitable
- If it is less than 1, the new technology is estimated to be NOT profitable
Variance & Uncertainty
This tool allows you to select the range of certainty for your cost estimates, resulting in a range of potential cost-benefit estimates. The lowest estimates from cost benefit analysis are considered the most conservative, i.e. the worst-case scenario. If the conservative 'worst case scenario' is still profitable, then the model projects that your organization would still benefit from the new technology even with the worst combination of costs and benefits. Since it is not always possible to get precise costs when estimating the amount of labour, maintenance, and productivity increases, this tool also provides information to allow for educated estimates.
Selecting Inputs: What numbers should I use?
In many cases, it is not possible to know in advance what all the costs will be. For each input to the model, we provide background information, things to consider, and the numbers we found during the needle-less injector study. Of course, each new technology is different, but it is hoped that this background information will allow you to make an educated guess about the numbers for your enterprise. Note that all of the inputs must be completed, even if the value is zero "0".
To access the background information for each input, click on the input name.
Interpreting the cost-benefit report
Incremental benefit-to-cost ratio
Cost benefit calculations are reported in Canadian dollars
- If the incremental cost-to-benefit ratio is greater than one, the new technology is estimated to be profitable
- If the incremental cost-to-benefit ratio is less than one, the new technology is estimated to be NOT profitable
A range of estimates is also reported based on a percentage variance entered by the user. If the lowest incremental cost-to-benefit ratio is greater than one with the new technology, that means that the new technology is likely to be profitable even under the 'worst-case scenario' set by the variance percentage. However, even if the incremental cost-to-benefit ratio is less than one, there could still be intangible benefits (i.e. not quantifiable in dollars). For example, you might decide new technology is desirable if it has intangible benefits such as improvements in worker morale; these can sometimes lead to quantifiable changes in worker retention, reduced turnover and training costs.
Currently, the calculator does not calculate return on investment or ROI. However, this could be included as part of a future version. Please let us know if you have feedback or ideas for improving the tool.
Interpret with caution
Please note that all model reports are estimates for information purposes, and not a guarantee. The model cannot account for all possible variables and is only as accurate as the numbers given as inputs.
Feel free to try the model several times with several different inputs, this will give you an idea about the range of values you might get.
Technology lifespan
Expected lifespan of the new technology
The time horizon is the time frame for calculating cost benefit and is related to the expected lifespan of the tool or technology. The default time range for this calculation is one year. If the technology equipment will last multiple years, you can select another time period for calculating the cost-benefit. For example, if the tool is expected to last 10 years, the time horizon will be 10 years. Sources of information for the lifespan of a tool could be the manufacturer, consumer reports, or other producers.
As an example from previous research, the needle-less injector equipment was estimated by the manufacturer to last for 9 years. Some barns may find that their equipment will last slightly more or less than the manufacturer's estimate.
Equipment start-up cost
Purchase price for new technology
The cost of initial purchase of the device, tool, or technology. The start up cost involves any expense related to the initial purchase of the new technology. Consider any tools that will be needed, the cost of warrantee, delivery, and any exchange rates if the item is coming from another country.
In the case of the needle-less injector, the initial start-up costs included the injector device itself, as well as toolkits needed for daily and weekly maintenance of the system and in some cases, and the cost of either a compressor or gas cylinders to operate the hydraulic system. The combined start-up costs for needle-less injectors ranged from $3107 to $7652.
Consumables and ongoing costs
Yearly cost of materials to operate the new technology
Some technologies have an ongoing materials or consumables cost. These might include lubricants, fuel, substrates, paper, medications, or other items that get used up during use and need to be replaced in order to use the technology.
In the case of the needle-less injector, consumables mostly included supplies for routine maintenance of the system, such as vinegar, sterile water, lubricants, etc. The annual consumables cost for the needle-less injector ranged from $460 to $3271.98 per year.
Disposal cost
Yearly cost for any disposal needs related to new technology
Some types of technology will require disposal of waste products, or have specific environmental levies related to either a device or the consumables. There may also be biosecure or contaminated waste disposal, or impacts on existing disposal costs such as removal of dead animals or pumping manure lagoons.
In the case of the needle-less injector, there were no costs associated for the needle-less method but the disposable needle comparisons had a cost for biosecure disposal of sharps. The disposal cost associated with needles and syringes could range from $418 to $3746 per year.
Current energy cost
Current annual energy costs
This can be summarized from your utility bills for a typical year. Note that there might be seasonal variations in energy use, so multiplying one monthly bill might not be representative of a whole year. If there are no anticipated changes in energy, enter zero ("0"); this item cannot be left blank.
Anticipated Change in energy cost
% difference in energy consumption
Energy costs are calculated as a percentage change from your current energy use. If no change in energy consumption is anticipated, you can enter zero on the energy lines. For the needle-less injector project, the increased energy cost (arising from electricity for compressor use) was considered to be trivial with respect to other costs.
We have provided an example of the energy use required for a fan intended to run constantly (8760 hours per year). The power ratings of tolls and devices are usually reported by the manufacturers on the box or on a website. Let's say it's a 20hp fan. If 1 hp = 1kW, then 20 hp =20 kW, then the power consumption of the fan for a year will be 8760hrs per year x 20kW = 175,200 kWh. The cost rates for electricity are available on your utility bills. If the cost per kWh is 5.5 cents, then the annual power cost for the fan will be $9636
You can divide the consumption of your tool with your total annual energy consumption to get the % change in energy. This might indicate either an increase (positive percentage) or decrease (negative percentage) in energy consumption.
Current Feed Costs
The current annual cost of feeds are entered if it is directly related to, or is impacted by, the new technology. If the new technology does not affect animal feeds, enter zero ("0"); this item cannot be left blank.
Anticipated Change in feed costs
% difference in feed costs
You can divide the current feed costs with your anticipated feed costs to get the % change. This might indicate either an increase (positive percentage) or decrease (negative percentage) in feed consumption.
Hourly Wage
This is the wage for those workers directly involved with using and maintaining the new technology. The lowest value would be the minimum wage in your province. This item cannot be left blank.
Turnover rate
% turnover per year among workers directly involved with the technology
High turnover can be costly to any organization because there will be a need to train replacements. The percentage of employees leaving the company (barn) within a year expressed as a percentage of all workers working in your barn.
To calculate Turnover rate:
If no workers leave the barn and need to be replaced, then the percentage is zero.
If there are 20 workers in the barn and 5 are replaced in a year, the turnover rate is 5/20 or 25%.
If the same job has 20 different people in it during a year, the turnover rate is 20/20 or 100%.
Previous estimates have swine barn turnover rates ranging from 15% to 45%. It should be noted that this web tool does not consider the costs associated with the time lag between the exit of an employee and the time to fill the vacant position, nor the recruitment costs for hiring new workers.
Maintenance Time
Hours per year for any cleaning, maintenance, and repairs anticipated
This include costs of labour for: a) routine cleaning or maintenance after each use (daily) and b) or parts replacement that occur less frequently.
In the case of the needle-less injector, routine maintenance on the needle-less injector is vital to ensure safe operation and longevity. Routine maintenance, such as O-ring changes, lubrication of the amplifier (CO2 regulator), and flushing the fluid path, were performed on a daily and weekly basis. Note that any separate maintenance tools are included in the start-up cost, and any parts or supplies that get used up (like o-rings) and are included in consumable costs.
The average daily cleaning time for the needle-less injector was 19.5 minutes, and the weekly maintenance routine for lubrication and parts replacement took 32.5 minutes, on average. Multiplying the daily and weekly costs into a full year translated into an annual (average) maintenance labor cost of $2652 with a range from $548 to $6570.
Workers involved with technology
Number of workers directly involved with the technology
These are workers involved with maintenance or daily production use of the technology. This is related to training costs, so input a number of individuals, rather than a number of full-time equivalents (FTEs).
Training time
Hours of training required per worker
This cost includes the time dedicated to training, but it could also include the reduced productivity that happens before people gain full competency with a new technology.
Consider any training required before the first time workers use the new technology, and any reduced productivity while a worker gets used to the new technology. This will be the training time per worker, and will be multiplied by the number of workers involved with the technology, the annual turnover rate, and wage rate. If you pay an external trainer, enter those hours as well.
Example training time estimate
- The hours spent during training to use the device (let's say it's 4 hours of training)
- The number of work hours where productivity would be decreased. To estimate this effect, you can add some hours of 'on the job training'. For example, if productivity is about 80% for the first 2 weeks using the new technology, 10 days x 8hrs/day x 20% = 16 hours
The total of initial training and reduced productivity represents the cost of a new worker 'getting up to speed' with a new tool or technology. In the case of this example, the total training hours are 4 + 16 = 20 hours where you have to pay workers without them being productive.
Note that the training costs will be affected by the turnover rates, since a new employee needs to be trained and develop the skills required for the job.
In the case of the needle-less injector, there was no up-front maintenance cost, but workers were considered to have reduced productivity (60% of usual) for 1 month after starting to use the needle-less injector.
Technology-related labour
Hours of additional labour required (+) or hours saved (-) each year
This is the direct labor cost of using the new technology in operations, excluding training time. This measures the change in labour needs. If the new technology will need extra labour hours each year, this will be a positive number. If you anticipate that the new technology will save hours of labour, for example, by automating some process, then this will be a negative number. The webtool will multiply the annual number of hours saved or required by the wage rate to estimate labour costs or savings of the new technology.
In the case of needle-less injectors, injecting nursery pigs takes about 40% less time with a needle-less injector as with a conventional needle. If this reduces 2 hours of work every day, 5 days per week, then this would save about 521 hours per year; as a cost savings, -521 (negative number) would be entered for this cost.
Injury-Related Cost
Cost associated with injuries resulting from the technology
Injuries can cost a business in a few different ways.
There are costs related to each event. For example, even a "health-care only" WCB claim could require a half day off work to see a doctor. This is lost productivity time since the worker would still get paid. Long-term leave to recover from an injury is generally paid for by WCB insurance and so is not paid directly by the employer. However, if a worker takes long-term leave, you may need a new worker to replace them, and that worker would need to get trained. Alternatively, if a worker takes a disability leave, other workers may be asked to work overtime, and may be paid a higher wage rate (i.e. time and a half) for those hours.
There are also insurance premiums that can go up over time. If an employer has a very good or very bad experience rating for WCB insurance, it impacts their premiums. WCB premiums are paid as a percentage of payroll, and the difference in insurance rates (as a percentage of payroll). For example, using insurance rate information from Saskatchewan, the industry base rate is $2.48 for the year 2019. The lowest possible rate would be $7.44 (200% surcharge).
How do I know if there will be occupational health & safety impacts?
Clearly, injuries can increase costs in several ways. However, the impact that a new technology will have on occupational health and safety is not always easy to predict. When implementing a new technology, take time to fully consider all the types of hazards that it could impact.
Sometimes a new technology can solve one problem and introduce another. As an example, in the case of swine injection, the main injury types we considered were needle-stick related injury and upper limb musculoskeletal disorders like carpal tunnel syndrome. Although needle-less injectors help eliminate needle-stick injuries, we thought they might introduce new hazards, such as higher repetition, more forceful gripping, or other postural strain due to intensified task speed.
We did find that after implementing the needle-less injectors, the rates of needle stick injury went down from 2.13% per 100,000 fulltime equivalent employees (FTE) to 0.74%. (The rate does not go to zero since there is still need for some needles in the barn for one-off treatments that are not appropriate for the needleless injector.)
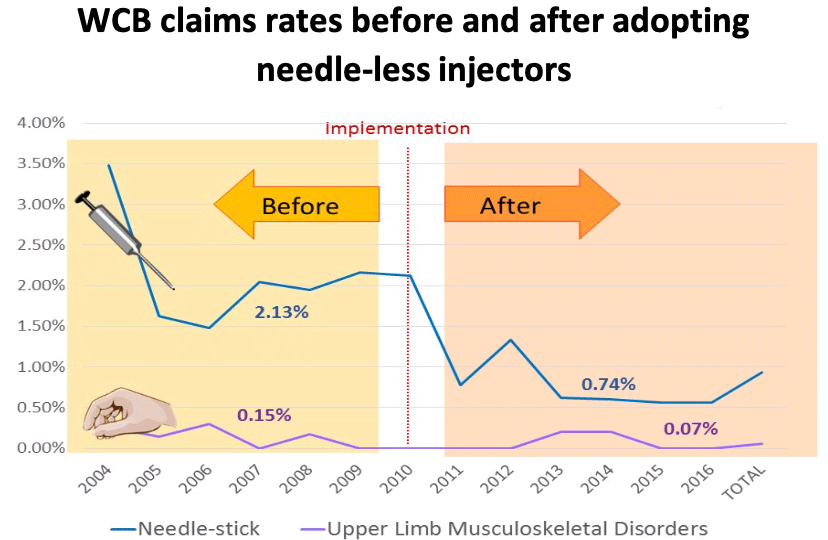
However, when we investigated the claims rates for upper limb disorders, we found there was negligible change after the introduction of needle-less injectors (0.15% to 0.07%).
Checklist of potential occupational health & safety impacts
Different types of technology might introduce different types of risk. The questions on this checklist can help identify hazards that might be related to introducing new technology in your workplace.
Chemical Hazards
Manure Gas (H2S, Ammonia, Methane)
Will the new technology change the way that manure is stored, pumped, or removed? Will it change the access that workers have to areas where pumping or removal is happening?
Dust
Will the new technology introduce new sources of dust, or will it change the way dust circulates or settles in the facility? Will there be new requirements for removing or disturbing dust?
Chemicals and WHMIS
Will the new technology introduce chemicals for cleaning, lubrication, or as substrates for a new process? What hazards are listed on the relevant material safety data sheets (MSDS)?
Medication
Will the new technology introduce new animal medications, vaccines, or nutritional supplements? Could workers come into contact with these through ingestion, inhalation, skin contact, or injection?
Biological Hazards
Swine-borne pathogens
Will the new technology change the way workers are exposed to pig body fluids? Could workers come into contact with these through ingestion, inhalation, skin contact, or injection?
Endotoxin and respiratory allergens
Will the new technology change the types of biological material that workers are exposed to, such as feed, animal bedding, or other plant or insect material?
Fungus, yeast and mold al and bacterial infections
Will the new technology change the environment towards conditions that are favourable for fungus growth, such as water sources, damp conditions, warm environment and unprotected building materials or other food sources?
Bacterial infections
Will the new technology increase the likelihood of workers breaking the skin and becoming more vulnerable to infection?
Physical Hazards
Electrical
Will the new technology use electricity, or require installation of new electrical panels and conduits? Will there be an opportunity for locking out machinery for maintenance?
Noise
Will the new technology introduce any noise sources to the workplace, or reduce barriers and enclosures of existing noise sources?
Vibration
Will the new technology require workers to sit or stand on vibrating machinery, like vehicles or forklifts? Will the technology require the use of vibrating handtools, like pneumatic torque wrenches or drills?
Fire
Will the new technology introduce a source of heat, fuel, or oxygen that could impact fire risk? Will the new technology change the emergency exits or the fire evacuation plan of the facility?
Radiation and lasers
Will the new technology introduce ionizing or not ionizing radiation, including electromagnetic, ultra violet, or lasers?
Ergonomics
Manual handling
Will the new technology require workers to lift, push, or pull heavy or awkward loads? How often will the handling be required, and what equipment will be available to help?
Repetition
Will the new technology require workers to perform the same task over and over, with few rest breaks or variation in their work? How frequently will this work be required? What levels of precision are required for this work?
Static positions
Will the new technology require workers to sit or stand for long periods, or to maintain awkward postures like bending over or reaching the hands above shoulder level?
Restrictions on movement
Will the new technology prevent workers from being able to move freely, either from containment by physical space constraints or a production requirement to stay in the same spot/position?
Visual demands
Will the new technology require workers to see and interpret visual data, such as instructions, a data display, or to confirm an area is free of obstacles and other workers? Will the new technology introduce any barriers to vision, such as reducing lighting, introducing dust or mist, or increasing distance to a display?
Temperature stress
Will the technology introduce a heat source that could increase the temperature in the barn during the hot season? Will the new technology require workers to go outside in cold weather, or require the doors and windows to be open during the cold season? Will fans or HVAC be available to regulate temperature changes?
Shift work
Will the new technology change the work schedule, or alter the duration or work shifts?
Computer workstations
Will the new technology require new workers to spend time at a computer workstation, or increase time for existing office workers?
Safety Hazards
Confined space
Will the new technology require workers to enter confined spaces with limited access and not intended for continuous human occupancy?
Working at height
Will the new technology require workers to access the roof, catwalks, ceiling panels, augers, conveyors or grain bins?
Slips and trips
Will the new technology introduce new floor surfaces or change the floor surfaces to potentially reduce friction? Will it introduce new obstacles or tripping hazards in the forms of hoses or control boxes?
Working alone
Will the new technology require workers to work alone or in isolation, out of sight or beyond easy calling distance from other workers for extended periods?
Machinery
Will the new technology introduce new machinery that potentially presents a risk of entanglement, entrapment, shearing, or burning?
Motor Vehicle Collisions
Will the new technology require new workers to operate motor vehicles or ride-on machinery? Will it change the route, vehicle, or other requirements of existing motor vehicle operators?
Psychosocial hazards
Time pressure
Will the new technology change the speed or rate of works, or alter the nature of deadlines and work loads?
Work demands (quantity, quality)
Will the new technology change the demands for work quality or quantity?
Control latitude
Will the new technology reduce or change the ability of workers to organize their own work? Will successful use of the technology depend on factors outside the workers' control? (e.g. weather, market prices)
Find Additional resources for assessing risks at:
- WorkSafeBC Risk Assessment website
- Quick Exposure Check (QEC) https://www.ohcow.on.ca/edit/files/25thanniversary/Quick%20Exposure%20Check%20Overview.pdf
- Canadian Centre for Occupational Health and Safety https://www.ccohs.ca/
- Occupational Health Clinics for Ontario Workers https://www.ohcow.on.ca/
- Agricultural Health and Safety Network http://aghealth.usask.ca/
- DASH Outcome Measure https://www.iwh.on.ca/tools-and-guides/dash-outcome-measure
- SAFE Work Manitoba https://www.safemanitoba.com/Pages/default.aspx
- Institute for Research on Work and Health Resources https://www.iwh.on.ca/publications
OSH prevention costs
Costs related to protective measures needed for safe use of the new technology
Separate from the potential cost of injury are the costs of occupational health and safety efforts to prevent injury and illness in the workplace (and hopefully investment in prevention will reduce injury!)
Once you have identified potential health and safety impacts related to specific hazards, you can identify some controls to put in place.
Controls of workplace hazards are generally organized in a hierarchy of most to least desirable in terms of promoting safety. This hierarchy of controls makes a starting place for selecting options; if the top-most option, eliminating the hazard, isn't feasible, then you move to the next option and so on.
Hierarchy of Controls
- Elimination involves getting rid of the hazard entirely by removing it from the workplace. This may require substantial changes to the nature of production, but ensures that no worker will encounter the hazard.
- Substitution involves substituting a hazard, for example a chemical, with an alternative that is less hazardous. Note that a substitution may introduce new hazards of its own.
- Engineering controls are those which alter the physical workspace, equipment, or tools. Because they are 'built in' to production, they usually don't require memory or motivation on the part of the workers to use them. A ventilation system is an example of an engineering control for reducing toxic gas.
- Administrative controls are the 'paper option' and involve policies and procedures intended to reduce exposure by modifying behavior rather than the environment. Training, signage, rest schedules, and SOPs about safe materials handling are administrative controls. They are lower on the hierarchy because they usually require workers to remember them and stay motivated to keep using them, which means more supervision might be required for them to be successful.
- PPE (personal protective equipment) are wearable devices or clothing intended to help protect workers from contaminants in their environments. Gloves, coveralls, and respirators are all examples of PPE. PPE is only effective when it is in good condition, fits properly, and is worn correctly; this also depends on workers' memory and motivation.
While it is ideal to select options higher up on the hierarchy of control, this will depend on the nature of the hazards and the situation. If you are unsure which hazards might be present, check out the checklist of potential occupational health & safety impacts. Below are some resources to help you identify appropriate controls for potential hazards.
Occupational Health Resources
- Prairie Swine Centre Health and Safety Resourceshttp://www.prairieswine.com/economic-impact-of-research-in-the-swine-industry/
- http://www.prairieswine.com/protecting-farm-worker-health-and-safety-risks-and-hazards-associated-with-hog-production/
- http://www.prairieswine.com/agricultural-labour-%E2%80%93-meeting-the-safety-requirements/
- http://www.prairieswine.com/health-hazard-affecting-the-animal-confinement-farm-worker/
- Canadian Centre for Occupational Health and Safety https://www.ccohs.ca/
- Occupational Health Clinics for Ontario Worker https://www.ohcow.on.ca/
- Canadian Agricultural Safety Association https://www.casa-acsa.ca/
- Agricultural Health and Safety Network http://aghealth.usask.ca/
- DASH Outcome Measure https://www.iwh.on.ca/tools-and-guides/dash-outcome-measure
- SAFE Work Manitoba https://www.safemanitoba.com/Pages/default.aspx
- WCB Manitoba Resources https://www.wcb.mb.ca/resources
- WorkSafeBC Agriculture Resources https://www.worksafebc.com/en/health-safety/industries/agriculture
- Institute for Research on Work and Health Resources https://www.iwh.on.ca/publications/a>
- WSIB http://www.wsib.on.ca
Productivity Impacts
This is the change in value or 'benefit' in terms of dollars from market pig production
For the purposes of this analysis, 'benefits' are classified revenue from successfully sold market pigs. Some might consider a reduction in labour cost or other costs to be a benefit of the technology, but in this webtool, these types of benefits are calculated as reductions in cost.
Annual market pig production
Number of market pigs currently produced by the barn..
If you are considering a new technology that will apply to a single farrow to finish barn, then input the number of pigs produced only in that barn. If the technology will apply to all the barns within a pyramid, then input the number of pigs shipped out from the finishing barn in the pyramid.
Average market pig weight
Average number of kilograms for a market pig produced by the barn.
A typical weight for a market pig might be around 128 kilos, ranging from124 to 130. You can list your current average pig weight, or make a conservative estimate of slightly lighter pigs. If you believe the technology will increase pig weight, you might consider increasing it.
Market price for kilo of live pig
Price per kilo for live market pig
This price is listed in Canadian dollars. It will be multiplied by the average weight per pig and by the annual production to get the total number of pigs. Typically market prices per kilo could range from $1.25 - $2.
Since this is the variable that producers can control the least, the report will produce a graph that expresses the value of the new technology over a range of prices, between -$1 and +$1 from the price per kilogram you entered.
Anticipated Productivity changes
% change anticipated in number of pigs produced per year
The inputs listed above (annual production, average pig weight, and price per kilo) combine to estimate the current dollar value of production from a barn or enterprise. This percentage shows whether production is anticipated to increase (numbers greater than 100) or decrease (numbers below 100). If there is no change anticipated, enter 100; that is, anticipated production is 100% of current production, no increase or decrease. The percentage must be greater than zero.
Variance
Cost and Benefit Variance
If you are very uncertain about the cost and benefit, you can enter a larger variance to see how consistent the results are if things were to change. In order to be more conservative, you can pick a higher variance in costs and a lower variance in benefits. For example, a variance of 10% for costs and 5% for benefits are often used in economic models to account for variability in the numbers estimated.